

Prognostic value of the ratio of carcinoembryonic antigen concentration to maximum tumor diameter in patients with stage II colorectal cancer
Introduction
Colorectal cancer (CRC) is the third most common cancer and a global leading cause of cancer-related mortality (1,2). Stage II CRC involves a local tumor without lymph node metastasis and accounts for approximately 25% of all CRC cases (3,4). Radical surgery is the preferred treatment for stage II CRC; however, approximately 15–25% of patients still develop relapse or death within 5 years after surgery (5).While adjuvant chemotherapy is the standard treatment for stage III CRC after surgery, the benefits of adjuvant chemotherapy for stage II CRC remain controversial (6,7). Thus, the development of novel prognostic markers to predict recurrence or death is important to guide the selection of appropriate treatment for stage II CRC.
Carcinoembryonic antigen (CEA) is a widely used tumor marker (8), and several studies have indicated that high CEA concentrations are associated with an unfavorable prognosis among patients with stage II CRC (9-12). However, the prognostic value of preoperative CEA concentration remains controversial, as some studies have found that it is insufficiently sensitive and accurate when used alone, which has prompted attempts to provide better sensitivity and specificity by combining the CEA concentration with the neutrophil-to-lymphocyte ratio, CD44v6 concentration, or peritoneal carcinomatosis index (11,13,14). The vertical expansion of the primary tumor (T classification) is an important risk stratification factor for patients with stage II CRC, based on the 7th edition of the American Joint Committee on Cancer guidelines (15,16). However, there is controversy regarding the prognostic value of the horizontal tumor expansion, which is often measured as the maximum tumor diameter (DMAX) in cases of CRC (17,18). A previous study has indicated that the ratio of prostate-specific antigen concentration to tumor size was a useful prognostic marker for prostate cancer (19), and a recent report from our center also indicated that the ratio of preoperative CEA concentration to DMAX (CEA/DMAX) may be a prognostic factor for patients with rectal cancer (20). The CEA/DMAX value reflects the relative CEA secretion per unit of tumor size; thus, a high CEA/DMAX value may indicate a more aggressive and malignant phenotype. Nevertheless, it remains unclear whether the CEA/DMAX can predict outcomes among patients with stage II CRC.
Thus, the present study evaluated data from 2,499 patients with stage II CRC, who were stratified into groups with low and high CEA/DMAX values to determine the prognostic value of this marker. We also developed simple-to-use nomograms for predicting outcomes based on the CEA/DMAX and other common clinicopathological features. Finally, given the location-specific tumorigenesis and development of CRC, we performed subgroup analyses to determine whether the CEA/DMAX could predict outcomes among patients with colon or rectal cancer. We present the following article in accordance with the REMARK reporting checklist. Available at: https://dx.doi.org/10.21037/jgo-21-61.
Methods
The study was conducted in accordance with the Declaration of Helsinki (as revised in 2013). The retrospective study protocol was approved by the Medical Ethics Committee of the Sixth Affiliated Hospital of Sun Yat-sen University (Guangzhou, China; No.: 2021ZSLYEC-006) and informed consent was obtained from all patients for use of their data for research purposes.
Inclusion and exclusion criteria
Patients with primary stage II colorectal adenocarcinoma who underwent radical resection at the Sixth Affiliated Hospital of Sun Yat-sen University between January 2010 and March 2019 were studied. All retrospective data were collected from the database maintained by the Sixth Hospital of Sun Yat-sen University. However, patients were excluded if they: (I) had received preoperative radiotherapy or chemotherapy, (II) more than one primary lesion, or (III) no data regarding preoperative CEA or DMAX values.
Demographic and clinical variables
The patients’ records were searched to collect data regarding preoperative clinicodemographic characteristics, which included age at surgery, sex, tumor location and preoperative CEA concentration (ng/mL). The postoperative pathological reports were also reviewed to collect data regarding the DMAX (cm), gross specimen type, T stage (based on the 7th edition of the American Joint Committee on Cancer guidelines), lymphovascular invasion, number of examined lymph nodes, and histological differentiation. Tumor location was classified as involving the colon (cecum to rectosigmoid) or rectum. The cut-off value for CEA concentration was defined as 5.00 ng/mL, based on previous reports (20,21). DMAX was measured by at least two pathologists based on the diameter of the largest cross-section of the tumor. Postoperative follow-up had been scheduled for surveillance every 3 months during the first year after the surgery, every 6 months during the next 2 years, and then annually thereafter. The follow-up time ended in March 2020. Overall survival (OS) was calculated from the first surgical resection to death because of any cause, and disease-free survival (DFS) was calculated from the first surgical resection to the first instance of recurrence, metastasis, or death (22,23).
Univariable and multivariable Cox regression analyses
Univariable and multivariable Cox regression analyses were used to identify factors that were associated with OS and DFS. Differences were considered statistically significant at two-sided P values <0.05, and significant variables from the univariate analyses were subsequently entered into the multivariable Cox regression model (forward stepwise).
Construction and evaluation of the nomograms
The results of the multivariable Cox regression analyses were used to construct two simple-to-use nomograms, including the CEA/DMAX and three other clinicopathological parameters, that could predict the 1-, 3-, and 5-year rates of OS and DFS. The nomograms’ performances were evaluated based on the concordance index (C-index), receiver operating characteristic (ROC) curve analysis, and calibration curves. The C-index was defined as the proportion of concordant pairs divided by the total number of possible evaluation pairs (24). The 1-, 3-, and 5-year ROC curves were used to assess the discriminative abilities of the nomograms over different time periods (25). The 1-, 3-, and 5-year calibration curves were used to evaluate whether the nomograms’ predictions were consistent with the observed clinical risks (26).
Statistical analysis
Categorical variables were reported as number (percentage) and continuous variables were reported as median (interquartile range, IQR). Categorical variables were compared using the χ2 test or two-tailed Fisher’s exact test. Continuous variables were compared using the independent samples t-test or Mann-Whitney U test. Survival curves were estimated using the Kaplan-Meier method and compared using the log-rank test. All analyses were performed using R (version 4.0.1, The R Foundation for Statistical Computing, Vienna, Austria) and the “tableone,” “survival,” “survminer,” “rms,” “timeROC,” and “regplot” packages.
Results
Patient characteristics
The study included 2,499 patients with primary stage II CRC who underwent radical resection during 2010–2019 (Figure 1), and their clinicodemographic characteristics are shown in Table 1. The median age was 62 years (IQR:52–70 years) and the cohort included 969 female patients (38.78%). A preoperative CEA concentration of >5.00 ng/mLwas identified for 890 patients (35.61%). The tumors were classified as colon cancer (1,632 patients, 65.31%) or rectal cancer (867 patients, 34.69%). The radical surgeries were classified as right colectomy for 668 patients (26.73%), transverse colectomy for 70 patients (2.80%), left colectomy for 217 patients (8.68%), sigmoidectomy for 652 patients (26.09%), low anterior resection for 728 patients (29.13%), abdominoperineal resection for 138 patients (5.52%), and Hartmann’s procedure for 26 patients (1.05%).


Full table
Postoperative pathological examinations revealed pT3 disease in 2,280 patients (91.24%) and pT4 disease in 219 patients (8.76%). Lymphovascular invasion was identified in 124 patients (4.96%). The average CEA/DMAX value was 2.33 (ng/mL per cm), which was used to stratify the patients into a low CEA/DMAX group (≤2.33, 1,985 patients) and a high CEA/DMAX group (>2.33, 514 patients). Relative to the low CEA/DMAX group, the high CEA/DMAX group was significantly older [median age: 63 years (IQR: 55–72 years) vs. 61 years (IQR: 51–69 years), P<0.001], had a significantly smaller median DMAX [4.00 cm (IQR: 3.00–5.00 cm) vs. 4.40 cm (IQR: 3.40–6.00 cm), P<0.001], and had significantly higher proportions of female sex (45.72% vs. 36.98%, P<0.001), CEA concentration of >5.00 ng/mL (98.05% vs. 19.45%, P<0.001), and pT4 disease (13.23% vs. 7.61%, P<0.001) (Table 1).
Kaplan-Meier analyses of OS and DFS
The Kaplan-Meier curves revealed that the high CEA/DMAX group had significantly poorer OS (67.31% vs. 85.02%, P<0.001) (Figure 2A) and significantly poorer DFS (61.41% vs. 77.10%, P<0.001) (Figure 2B).

Univariate and multivariable Cox regression analyses of OS and DFS
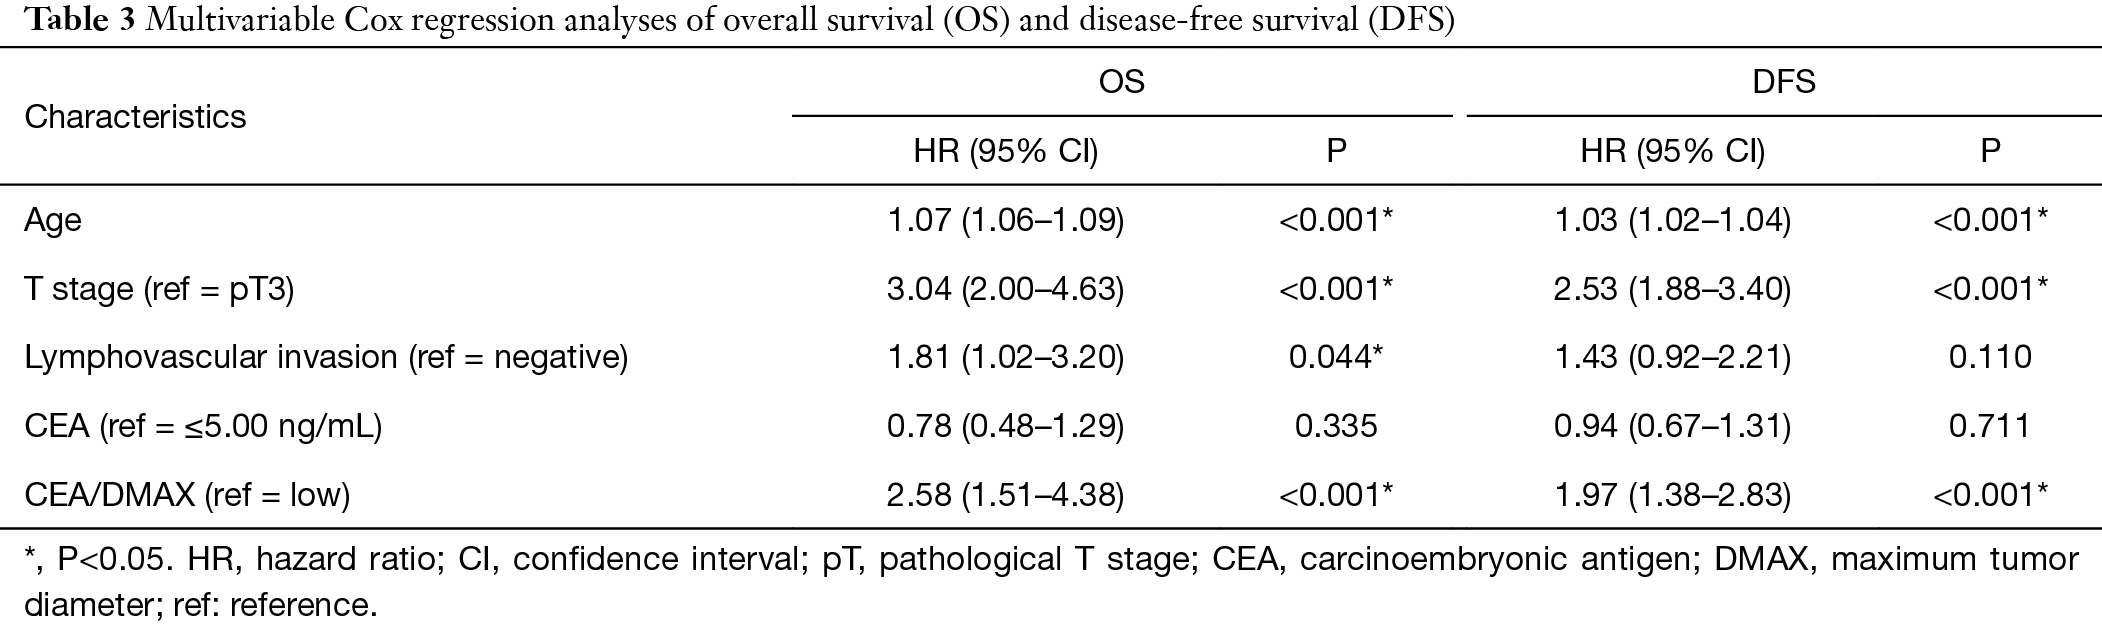
The univariate analyses (Table 2) revealed that OS and DFS were significantly associated with age, T stage, lymphovascular invasion, CEA concentration, and CEA/DMAX (all P<0.05). These factors were entered into the multivariable Cox regression analysis, which confirmed that OS was independently associated with CEA/DMAX [hazard ratio (HR): 2.58, 95% confidence interval (CI): 1.51–4.38, P<0.001], age (HR: 1.07, 95% CI: 1.06–1.09, P<0.001), T stage (HR: 3.04, 95% CI: 2.00–4.63, P<0.001), and lymphovascular invasion (HR: 1.81, 95% CI: 1.02–3.20, P=0.044) (Table 3). However, lymphovascular invasion was not independently associated with DFS, although DFS was independently associated with age (HR: 1.03, 95% CI: 1.02–1.04, P<0.001), T stage (HR: 2.53, 95% CI: 1.88–3.40, P<0.001), and CEA/DMAX (HR: 1.97, 95% CI: 1.38–2.83, P<0.001) (Table 3).

Full table
Full table
Construction and evaluation of the nomogram
Based on the results of the multivariable Cox regression analysis, the CEA/DMAX and three other clinicopathological features (age, T stage and lymphovascular invasion) were used to develop nomograms for predicting OS and DFS outcomes (Figure 3). These easy-to-use tools might allow clinicians to calculate total scores based on those four parameters, which could then be used to predict the 1-, 3-, and 5-year rates of OS and DFS. The nomogram for OS had a C-index value of 0.774 and area under the curve (AUC) values of 0.781 for 1-year OS, 0.802 for 3-year OS, and 0.814 for 5-year OS (Figure 3B). Furthermore, the calibration curves revealed that the predicted 1-, 3-, and 5-year outcomes fit well with the reference lines (Figure 3C−E). Thus, the nomogram for OS was judged to have good predictive and discriminative abilities. The nomogram for DFS had a C-index value of 0.651 and AUC values of 0.709 for 1-year DFS, 0.704 for 3-year DFS, and 0.644 for 5-year DFS (Figure 3G). Moreover, the calibration curves revealed that the predicted 1-, 3-, and 5-year outcomes fit well with the reference lines (Figure 3H−J). Thus, although the DFS nomogram was not as accurate as the OS nomogram, it still had reasonable predictive value.

Subgroup analyses of patients with stage II colon or rectal cancer
Several studies have indicated that colon cancer and rectal cancer have cc (27,28). Thus, we performed subgroup analyses to determine whether the CEA/DMAX had prognostic value among patients with colon or rectal cancer. The results revealed that a high CEA/DMAX was associated with significantly poorer OS (P<0.01) and DFS (P<0.001) among patients with stage II colon cancer and stage II rectal cancer (Figure 4). Thus, the CEA/DMAX seems useful for different anatomic locations of stage II CRC.

Discussion
Some patients with stage II CRC still have a high risk of recurrence or death after radical surgical treatment (29-31), and the National Comprehensive Cancer Network guidelines recommended adjuvant chemotherapy for patients with related risk factors (15,32). However, these factors do not include the CEA/DMAX and the prognostic value of the CEA/DMAX has not been previously studied among patients with stage II CRC. The present study evaluated the prognostic value of the CEA/DMAX in a cohort of 2,499 patients with stage II CRC and revealed that patients with a high CEA/DMAX value (≥2.33) also had high likelihoods of having various unfavorable features, such as older age, higher CEA concentration, and pT4 stage. In this context, previous studies have indicated that older age and pT4 stage are associated with poor outcomes among patients with stage II CRC (24,33,34). In addition, the present study revealed that the CEA/DMAX was independently associated with OS (HR: 2.58, 95% CI: 1.51–4.38, P<0.001) and DFS outcomes (HR: 1.97, 95% CI: 1.38–2.83, P<0.001).
International guidelines recommend diagnosing CRC and monitoring post-treatment outcomes based on the concentration of CEA, which is mainly secreted by solid tumors (15,35,36). Previous studies have also indicated that CEA concentrations can independently predict survival (37-39), but we did not observe significantly associations between CEA concentrations and OS or DFS outcomes. Similarly, other studies have indicated that CEA concentration is not a sufficiently sensitive prognostic marker for CRC, as it can be influenced by various confounding factors, including DMAX (11,20,40). Interestingly, DMAX may also be a prognostic factor that can help identify patients who might benefit from additional postoperative therapy (18,41). For example, Takahashi et al. (42) were the first to report that a DMAX of <4.0 cm (vs. ≥4.0 cm) was associated with a significantly increased risk of recurrence, and several subsequent studies have also indicated that a small DMAX is associated with an unfavorable prognosis in cases of stage II CRC (17,43). The present study did not detect significant relationships between DMAX alone and survival outcomes among patients with stage II CRC, although the CEA/DMAX was an independently predictor of OS and DFS in the multivariable analyses. Thus, considering DMAX and CEA concentration together may be a useful strategy for predicting outcomes among patients with stage II CRC. Previous studies have also indicated that CEA concentrations may be correlated with DMAX, regardless of tumor stage (44-46). Thus, the CEA/DMAX may be superior to CEA concentration alone, as a higher CEA/DMAX value would reflect relatively greater CEA secretion per unit of tumor size, which would indicate a more aggressive and malignant phenotype that could explain the poor outcomes among patients with high CEA/DMAX values.
A nomogram is developed using multiple predictive factors from a complex regression equation, which are transformed into visualized graphs to facilitate simple and can rapid patient evaluation in clinical practice (24). In this study, we developed two nomograms incorporated CEA/DMAX, age, T stage, and lymphovascular invasion to predict 1-, 3-, and 5-year rates of OS and DFS among patients with stage II CRC. The results for the C-index, ROC curve analysis, and calibration curves revealed that both nomograms had good predictive and discriminative abilities, which might make them clinically useful for predicting outcomes among patients with stage II CRC.
The biological characteristics and clinical outcomes of colon cancer and rectal cancer are clearly different (27). Thus, we performed subgroup analyses to explore the prognostic value of the CEA/DMAX among patients with stage II colon cancer or rectal cancer. The results revealed that high CEA/DMAX values were associated with poor OS (P<0.01) and DFS (P<0.001), regardless of anatomical location.
This study has two important limitations. First, the single-center retrospective design is prone to various sources of bias. Second, some patients had relatively short follow-up times, which might have influenced the accuracy of our findings. Therefore, large multi-center prospective studies with longer follow-up are needed to validate our findings.
Conclusions
In conclusion, relative to stage II CRC patients with low CEA/DMAX values, patients with high CEA/DMAX values had significantly poorer outcomes. We developed nomograms based on the CEA/DMAX, age, T stage, and lymphovascular invasion, which had good predictive and discriminative abilities and might be useful for identifying patients with a high risk of postoperative recurrence or death who might benefit from some type of adjuvant therapy. Furthermore, we observed that the prognostic value of the CEA/DMAX was not influenced by the tumor’s anatomical location.
Acknowledgments
The authors thank the staff at the Department of Colorectal Surgery, Sixth Affiliated Hospital of Sun Yat-sen University.
Funding: This work was supported by the National Key R&D Program of China [2017YFC1308800], National Natural Science Foundation of China [81770557, 82070684], and the Guangdong Natural Science Fund for Outstanding Youth Scholars [2020B151502067].
Footnote
Reporting Checklist: The authors have completed the REMARK reporting checklist. Available at: https://dx.doi.org/10.21037/jgo-21-61
Data Sharing Statement: Available at: https://dx.doi.org/10.21037/jgo-21-61
Peer Review File: Available at: https://dx.doi.org/10.21037/jgo-21-61
Conflicts of Interest: All authors have completed the ICMJE uniform disclosure form (available at: https://dx.doi.org/10.21037/jgo-21-61). The authors have no conflicts of interest to declare.
Ethical Statement: The authors are accountable for all aspects of the work in ensuring that questions related to the accuracy or integrity of any part of the work are appropriately investigated and resolved. The study was conducted in accordance with the Declaration of Helsinki (as revised in 2013). The retrospective study protocol was approved by the Medical Ethics Committee of the Sixth Affiliated Hospital of Sun Yat-sen University (Guangzhou, China; No.: 2021ZSLYEC-006) and informed consent was obtained from all patients for use of their data for research purposes.
Open Access Statement: This is an Open Access article distributed in accordance with the Creative Commons Attribution-NonCommercial-NoDerivs 4.0 International License (CC BY-NC-ND 4.0), which permits the non-commercial replication and distribution of the article with the strict proviso that no changes or edits are made and the original work is properly cited (including links to both the formal publication through the relevant DOI and the license). See: https://creativecommons.org/licenses/by-nc-nd/4.0/.
References
- Bray F, Ferlay J, Soerjomataram I, et al. Global cancer statistics 2018: GLOBOCAN estimates of incidence and mortality worldwide for 36 cancers in 185 countries. CA Cancer J Clin 2018;68:394-424. [Crossref] [PubMed]
- Global Burden of Disease Cancer Collaboration. The Global Burden of Cancer 2013. JAMA Oncol 2015;1:505-27. [Crossref] [PubMed]
- Lee JJ, Chu E. Adjuvant Chemotherapy for Stage II Colon Cancer: The Debate Goes On. J Oncol Pract 2017;13:245-6. [Crossref] [PubMed]
- Quah HM, Chou JF, Gonen M, et al. Identification of patients with high-risk stage II colon cancer for adjuvant therapy. Dis Colon Rectum 2008;51:503-7. [Crossref] [PubMed]
- Hari DM, Leung AM, Lee JH, et al. AJCC Cancer Staging Manual 7th edition criteria for colon cancer: do the complex modifications improve prognostic assessment? J Am Coll Surg 2013;217:181-90.
- Schippinger W, Samonigg H, Schaberl-Moser R, et al. A prospective randomised phase III trial of adjuvant chemotherapy with 5-fluorouracil and leucovorin in patients with stage II colon cancer. Br J Cancer 2007;97:1021-7. [Crossref] [PubMed]
- Niedzwiecki D, Bertagnolli MM, Warren RS, et al. Documenting the natural history of patients with resected stage II adenocarcinoma of the colon after random assignment to adjuvant treatment with edrecolomab or observation: results from CALGB 9581. J Clin Oncol 2011;29:3146-52. [Crossref] [PubMed]
- Konishi T, Shimada Y, Hsu M, et al. Association of Preoperative and Postoperative Serum Carcinoembryonic Antigen and Colon Cancer Outcome. JAMA Oncol 2018;4:309-15. [Crossref] [PubMed]
- Tsai HL, Huang CW, Chen CW, et al. Survival in Resected Stage II Colorectal Cancer Is Dependent on Tumor Depth, Vascular Invasion, Postoperative CEA Level, and The Number of Examined Lymph Nodes. World J Surg 2016;40:1002-9. [Crossref] [PubMed]
- Hashimoto T, Itabashi M, Ogawa S, et al. Sub-classification of Stage II colorectal cancer based on clinicopathological risk factors for recurrence. Surg Today 2014;44:902-5. [Crossref] [PubMed]
- Chen L, Jiang B, Wang Z, et al. Combined preoperative CEA and CD44v6 improves prognostic value in patients with stage I and stage II colorectal cancer. Clin Transl Oncol 2014;16:285-92. [Crossref] [PubMed]
- Hara M, Sato M, Takahashi H, et al. Does serum carcinoembryonic antigen elevation in patients with postoperative stage II colorectal cancer indicate recurrence? Comparison with stage III. J Surg Oncol 2010;102:154-7. [Crossref] [PubMed]
- Zhan X, Sun X, Hong Y, et al. Combined Detection of Preoperative Neutrophil-to-Lymphocyte Ratio and CEA as an Independent Prognostic Factor in Nonmetastatic Patients Undergoing Colorectal Cancer Resection Is Superior to NLR or CEA Alone. Biomed Res Int 2017;2017:3809464 [Crossref] [PubMed]
- Kozman MA, Fisher OM, Rebolledo BJ, et al. CEA to peritoneal carcinomatosis index (PCI) ratio is prognostic in patients with colorectal cancer peritoneal carcinomatosis undergoing cytoreduction surgery and intraperitoneal chemotherapy: A retrospective cohort study. J Surg Oncol 2018;117:725-36. [Crossref] [PubMed]
- Benson AB, Venook AP, Al-Hawary MM, et al. NCCN Guidelines Insights: Rectal Cancer, Version 6.2020. J Natl Compr Canc Netw 2020;18:806-15. [Crossref] [PubMed]
- Edge SB, Compton CC. The American Joint Committee on Cancer: the 7th edition of the AJCC cancer staging manual and the future of TNM. Ann Surg Oncol 2010;17:1471-4.
- Li X, An B, Ma J, et al. Prognostic Value of the Tumor Size in Resectable Colorectal Cancer with Different Primary Locations: A Retrospective Study with the Propensity Score Matching. J Cancer 2019;10:313-22. [Crossref] [PubMed]
- Dai W, Li Y, Meng X, et al. Does tumor size have its prognostic role in colorectal cancer? Re-evaluating its value in colorectal adenocarcinoma with different macroscopic growth pattern. Int J Surg 2017;45:105-12. [Crossref] [PubMed]
- Aminsharifi A, Howard L, Wu Y, et al. Prostate Specific Antigen Density as a Predictor of Clinically Significant Prostate Cancer When the Prostate Specific Antigen is in the Diagnostic Gray Zone: Defining the Optimum Cutoff Point Stratified by Race and Body Mass Index. J Urol 2018;200:758-66. [Crossref] [PubMed]
- Cai D, Huang ZH, Yu HC, et al. Prognostic value of preoperative carcinoembryonic antigen/tumor size in rectal cancer. World J Gastroenterol 2019;25:4945-58. [Crossref] [PubMed]
- Tang S, Lin L, Cheng J, et al. The prognostic value of preoperative fibrinogen-to-prealbumin ratio and a novel FFC score in patients with resectable gastric cancer. BMC Cancer 2020;20:382. [Crossref] [PubMed]
- Omuro A, Beal K, McNeill K, et al. Multicenter Phase IB Trial of Carboxyamidotriazole Orotate and Temozolomide for Recurrent and Newly Diagnosed Glioblastoma and Other Anaplastic Gliomas. J Clin Oncol 2018;36:1702-9. [Crossref] [PubMed]
- Sargent D, Sobrero A, Grothey A, et al. Evidence for cure by adjuvant therapy in colon cancer: observations based on individual patient data from 20,898 patients on 18 randomized trials. J Clin Oncol 2009;27:872-7. [Crossref] [PubMed]
- Mo S, Zhou Z, Li Y, et al. Establishment and validation of a novel nomogram incorporating clinicopathological parameters into the TNM staging system to predict prognosis for stage II colorectal cancer. Cancer Cell Int 2020;20:285. [Crossref] [PubMed]
- Wang Y, Zhao W, Xiao Z, et al. A risk signature with four autophagy-related genes for predicting survival of glioblastoma multiforme. J Cell Mol Med 2020;24:3807-21. [Crossref] [PubMed]
- Song LR, Weng JC, Li CB, et al. Prognostic and predictive value of an immune infiltration signature in diffuse lower-grade gliomas. JCI Insight 2020;5:133811 [Crossref] [PubMed]
- Tamas K, Walenkamp AM, de Vries EG, et al. Rectal and colon cancer: Not just a different anatomic site. Cancer Treat Rev 2015;41:671-9. [Crossref] [PubMed]
- Hemminki K, Santi I, Weires M, et al. Tumor location and patient characteristics of colon and rectal adenocarcinomas in relation to survival and TNM classes. BMC Cancer 2010;10:688. [Crossref] [PubMed]
- Ke J, Liu XH, Jiang XF, et al. Immune-related gene signature in predicting prognosis of early-stage colorectal cancer patients. Eur J Surg Oncol 2020;46:e62-e70. [Crossref] [PubMed]
- Wang K, Song K, Ma Z, et al. Identification of EMT-related high-risk stage II colorectal cancer and characterisation of metastasis-related genes. Br J Cancer 2020;123:410-7. [Crossref] [PubMed]
- Al-Temaimi RA, Tan TZ, Marafie MJ, et al. Identification of 42 Genes Linked to Stage II Colorectal Cancer Metastatic Relapse. Int J Mol Sci 2016;17:598. [Crossref] [PubMed]
- Dienstmann R, Salazar R, Tabernero J. Personalizing colon cancer adjuvant therapy: selecting optimal treatments for individual patients. J Clin Oncol 2015;33:1787-96. [Crossref] [PubMed]
- Burdy G, Panis Y, Alves A, et al. Identifying patients with T3-T4 node-negative colon cancer at high risk of recurrence. Dis Colon Rectum 2001;44:1682-8. [Crossref] [PubMed]
- Merkel S, Wein A, Günther K, et al. High-risk groups of patients with Stage II colon carcinoma. Cancer 2001;92:1435-43. [Crossref] [PubMed]
- Duffy MJ, Lamerz R, Haglund C, et al. Tumor markers in colorectal cancer, gastric cancer and gastrointestinal stromal cancers: European group on tumor markers 2014 guidelines update. Int J Cancer 2014;134:2513-22. [Crossref] [PubMed]
- Nicholson BD, Shinkins B, Pathiraja I, et al. Blood CEA levels for detecting recurrent colorectal cancer. Cochrane Database Syst Rev 2015;CD011134 [Crossref] [PubMed]
- Becerra AZ, Probst CP, Tejani MA, et al. Evaluating the Prognostic Role of Elevated Preoperative Carcinoembryonic Antigen Levels in Colon Cancer Patients: Results from the National Cancer Database. Ann Surg Oncol 2016;23:1554-61. [Crossref] [PubMed]
- Thirunavukarasu P, Sukumar S, Sathaiah M, et al. C-stage in colon cancer: implications of carcinoembryonic antigen biomarker in staging, prognosis, and management. J Natl Cancer Inst 2011;103:689-97. [Crossref] [PubMed]
- Huh JW, Oh BR, Kim HR, et al. Preoperative carcinoembryonic antigen level as an independent prognostic factor in potentially curative colon cancer. J Surg Oncol 2010;101:396-400. [Crossref] [PubMed]
- Stiksma J, Grootendorst DC, van der Linden PW. CA 19-9 as a marker in addition to CEA to monitor colorectal cancer. Clin Colorectal Cancer 2014;13:239-44. [Crossref] [PubMed]
- Santullo F, Biondi A, Cananzi FCM, et al. Tumor size as a prognostic factor in patients with stage IIa colon cancer. Am J Surg 2018;215:71-7. [Crossref] [PubMed]
- Takahashi T, Kato T, Kodaira S, et al. Prognostic factors of colorectal cancer. Results of multivariate analysis of curative resection cases with or without adjuvant chemotherapy. Am J Clin Oncol 1996;19:408-15. [Crossref] [PubMed]
- Wang Y, Zhuo C, Shi D, et al. Unfavorable effect of small tumor size on cause-specific survival in stage IIA colon cancer, a SEER-based study. Int J Colorectal Dis 2015;30:131-7. [Crossref] [PubMed]
- Molina R, Auge JM, Farrus B, et al. Prospective evaluation of carcinoembryonic antigen (CEA) and carbohydrate antigen 15.3 (CA 15.3) in patients with primary locoregional breast cancer. Clin Chem 2010;56:1148-57. [Crossref] [PubMed]
- Var T, Tonguc EA, Ugur M, et al. Tumor markers panel and tumor size of ovarian dermoid tumors in reproductive age. Bratisl Lek Listy 2012;113:95-8. [Crossref] [PubMed]
- Turkdogan S, Forest VI, Hier MP, et al. Carcinoembryonic antigen levels correlated with advanced disease in medullary thyroid cancer. J Otolaryngol Head Neck Surg 2018;47:55. [Crossref] [PubMed]

